Affordable Housing Policy: What’s Changed Recently
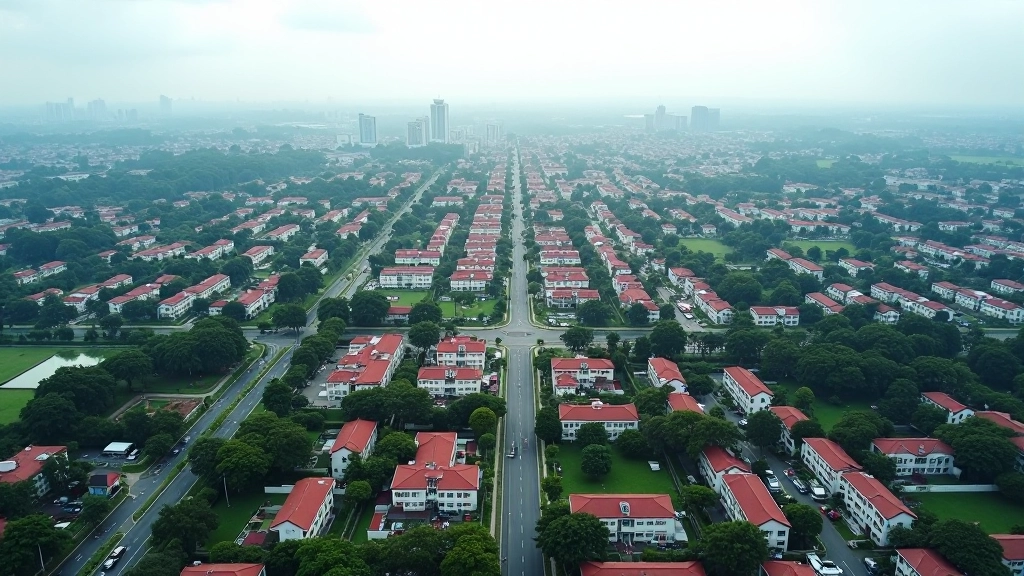
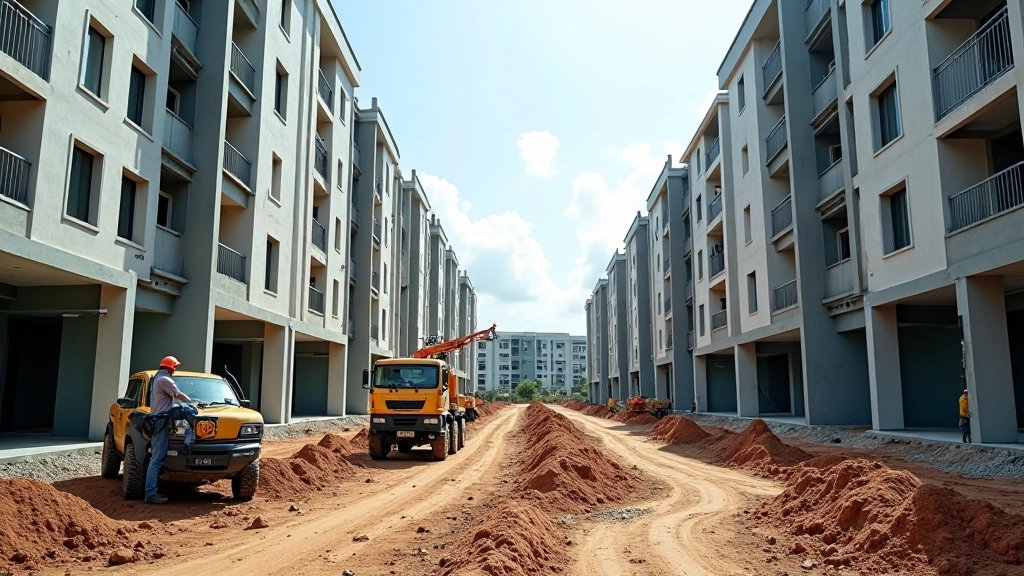
Overview of Malaysia’s affordable housing initiatives, government schemes, and how new policies are reshaping residential development and affordability targets.
Read ArticleHow property price indices track market movements and what rising or falling prices mean for buyers and investors in different regions

Property price indices aren’t just abstract numbers — they’re your window into what’s actually happening in Malaysia’s housing market. Think of them as a thermometer that measures the health of the real estate sector. When prices rise, it signals confidence and demand. When they fall, it often reflects economic uncertainty or oversupply.
These indices track price movements across different property types, regions, and price ranges. They’re calculated using actual transaction data, comparing prices today with historical baselines to show you real trends. We’re talking about concrete, measurable information that impacts whether homes become more or less affordable for everyday Malaysians.

Malaysian property indices measure several dimensions simultaneously. The National Property Information Centre (NAPIC) tracks residential prices across major urban areas like Kuala Lumpur, Selangor, Penang, and Johor. But here’s what matters — they break things down by property type: apartments, terrace houses, semi-detached homes, and bungalows each have their own trajectories.


A 5% year-on-year increase in property prices doesn’t sound dramatic, but it compounds. In Kuala Lumpur, we’ve seen periods where prices climbed 8-12% annually, making homes unaffordable for many middle-income families. Conversely, when indices drop 3-4%, it creates opportunities for first-time buyers but signals caution for investors.
The real insight comes from understanding where growth is concentrated. Secondary cities like Ipoh or Kuching might show modest 2-3% growth while the Klang Valley surges ahead at 6-7%. This divergence tells you something crucial: urbanisation is pulling investment capital toward major metros, leaving other regions behind. That’s not just statistics — that’s the story of how Malaysia’s economy is reshaping itself.
“Price indices aren’t predictions. They’re reflections of what’s already happened in the market. But they do reveal momentum — whether prices are accelerating, stabilising, or reversing course.”
Property price indices directly affect affordability, investment returns, and policy decisions that shape your housing options
Rising indices mean you’re facing tougher affordability hurdles. A 10% price increase could push monthly mortgage payments beyond your qualifying threshold. Understanding trends helps you decide whether to buy now or wait for market stabilisation.
Indices reveal which markets offer genuine appreciation potential versus speculation traps. Strong, consistent growth of 5-7% annually combined with rental demand signals a healthy investment. Volatile swings with declining rentals? That’s a warning sign.
Government housing schemes and affordable housing quotas are calibrated based on price index data. When indices spike beyond wage growth, it triggers policy interventions like rent controls or developer obligations to include affordable units.
Malaysia’s property market isn’t monolithic. Kuala Lumpur and Selangor command premium prices — we’re talking RM500,000 to over RM1 million for modest terrace houses. Meanwhile, Kedah or Terengganu offer similar properties at RM200,000-300,000. These aren’t just price differences; they reflect different economic realities, job markets, and infrastructure investments.
The Klang Valley (Kuala Lumpur, Selangor, Putrajaya combined) drives Malaysia’s price indices because it concentrates corporate headquarters, government offices, and economic activity. When tracking national trends, remember you’re looking at data heavily weighted toward this region. Penang comes second, then Johor. The rest of Malaysia moves at different rhythms, often disconnected from the headline national figure.

Price indices reveal patterns that help you anticipate what’s coming next
When indices show consistent double-digit growth over 2-3 years, demand exceeds supply. Prices climb faster each quarter. This is when developers build aggressively, thinking the boom will last forever. But it rarely does.
Growth flattens when prices reach affordability limits. Indices show single-digit growth or stagnation. Sales volume drops because fewer people can qualify for mortgages at these price levels. This phase signals market saturation.
Indices may decline 5-15% as overbuilt inventory floods the market. Sellers get desperate. But this creates opportunity — smart buyers find genuine value. Eventually, supply and demand rebalance, and prices stabilise at a new equilibrium.
Property price indices are tools, not crystal balls. They show you what’s happened and what’s currently happening. They reveal patterns and regional disparities. But they don’t predict the future with certainty. Economic shocks, interest rate changes, or policy shifts can disrupt established trends overnight.
What indices do brilliantly is prevent you from making decisions in isolation. If you’re considering buying in a market where prices have jumped 15% in one year while rental yields have declined, that’s a signal to ask hard questions. If indices show steady 4-5% annual growth with stable rental demand, you’re looking at a more balanced market. The numbers tell a story — you just need to read it correctly.
Understanding price indices is just the beginning. Explore how government affordable housing policies are reshaping market dynamics, or learn what mortgage market trends mean for your borrowing power.
Explore More ArticlesThis article is for informational and educational purposes only. It’s not investment advice, financial advice, or a substitute for professional guidance from qualified real estate agents, financial advisors, or lawyers. Property markets are complex and influenced by numerous variables — local economic conditions, interest rates, policy changes, and individual circumstances all matter. Property price indices provide historical context and trend analysis, but they don’t guarantee future performance or outcomes. Before making any property purchase or investment decision, consult with professionals who understand your specific situation and can provide personalised guidance.